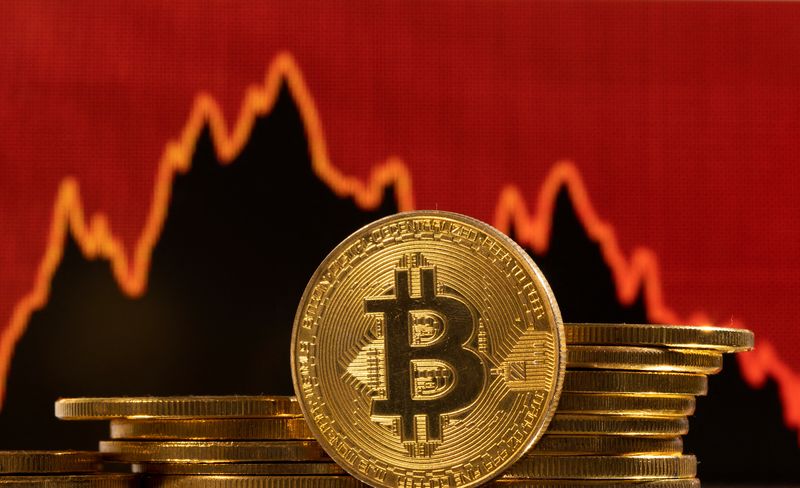
The cryptocurrency has been having trouble staying afloat in the face of larger market swings. If investors were expecting a recovery, the recent decline to a multi-month low is a worrying indicator. Bearish sentiment still rules the XRP market as seen by the inability to maintain gains above $0.5.
Technical indicator analysis reveals that XRP has been struggling with a number of significant moving averages. The current price action below the 200-day moving average (black line), which acts as a crucial long-term support level, is a bearish signal. The difficulty XRP is having in regaining upward momentum is further highlighted by the 50-day, 100-day and 26-day (green) moving averages. As a result of ongoing selling pressure, the price has continuously failed to break above these moving averages.
These moving averages’ convergence points to a lack of significant directional movement, which frequently occurs before important price shifts. XRP’s recent movement has regrettably been negative.
Volume trends also point to a lack of significant buying interest, as recent declines have been accompanied by higher-than-normal trading volumes. This suggests that an increasing number of traders are offloading their XRP holdings, which is pushing the price down.
The 50-day exponential moving average (EMA) is crucial for Solana. If Solana continues to trade above this line, it may indicate that the present downtrend is short-lived and a recovery is likely in store. At $159.00, Solana’s price is currently trading close to the 50 EMA (blue line).
Although there is some bearish sentiment, the price action suggests that SOL’s overall structure is still in place. A sustained move below this level could indicate more significant downside potential so investors should keep a close eye on it. Other moving averages show that the 200-day EMA is much lower, hovering around $130, while the 100-day EMA is located around $151.
In the event that the price declines even more, these levels serve as extra support and a buffer. The 100-day EMA’s proximity provides a secondary support zone that may be essential in averting a more significant sell-off. Solana has been trending upward, notwithstanding the current downturn.
The asset’s strong ecosystem and expanding utilization have contributed to its significant growth. Maybe the market is correcting itself, with this recent pullback giving it time to stabilize before a possible rebound.
Additionally, volume trends point to a stable market with no notable spikes that would suggest panic selling. Indicating that Solana is neither overbought nor oversold, the relative strength index (RSI) is positioned close to neutral. If market conditions improve, this balanced RSI reading suggests that there may be room for upward movement.
The overall structure of the Bitcoin market has not changed even with the recent decline below $70,000. As a safety net, the key support level at $68,000 is present. Bitcoin still has a strong base. This price is important because it is in line with important technical indicators and the sentiment of the market.
There have not been any notable spikes in selling pressure, according to volume trends, which suggests that the recent decline may have been a healthy correction rather than the beginning of a bearish trend. Because Bitcoin is neither overbought nor oversold, the RSI is in neutral territory, providing opportunity for future upward movement should market conditions improve.
This article was originally published on U.Today
To read the full article, Click Here
